"Winter Road" by Ryan Koch, REALTOR®, Keller Williams Realty in Madison. 2013 WRA Convention Photo Contest Entry.
Meh: “The verbal equivalent of the shrug of the shoulders.” — Urban Dictionary
Wisconsin’s economy and real estate markets continue to heal, but more slowly than most of us would like. In this article, I’ll explore recent performance — first by examining the national economy, then by comparing Wisconsin to other Midwest states. Finally I’ll offer a little prognostication for you to consume with your New Year’s libation.
Setting the stage: recent U.S. economic performance
Now in the fifth year since the “Great Recession,” we’re witnessing the beginning of a — so far — tepid recovery. I shrug my shoulders at recent economic performance — not because of indifference, but because of disappointment. Post-WWII, U.S. economic growth, as measured by real (inflation-adjusted) Gross Domestic Product per capita, has averaged about 2 percent per year, with little long-run decline. But since 2009, national growth has averaged 1.4 percent.
This slow growth is even more anemic than it first appears. The long-run 2-percent growth rate includes both recessions and expansions. From 1947 until the end of 2007, growth rates declined during recession quarters: during these 48 recession quarters, real GDP per capita “grew” by an annualized rate of -1.1 percent. During the Great Recession’s seven quarters, real GDP per capita “grew” -3.1 percent, more than double in the average recession. And the Great Recession lasted longer than any other postwar recession with the exception of the 1970s oil price shock. Hence, the moniker “Great” — as in very serious — “Recession.”
What about positives? Between 1947 and 2007, real GDP per capita grew annually by an average of 3.1 percent. That makes the post-Great Recession 1.4 percent even more anemic. In fact, some economists expected a V-shaped recovery after such a sharp decline. While reasons for this slow expansion will be analyzed and debated for years, I place some blame on the “balance sheet recession” story. Unlike garden-variety recessions where the Fed raises interest rates as inflation measures like the Consumer Price Index increase, the Great Recession was accompanied by a more serious financial crisis that left households and firms with balance sheets needing repair. And said repair slowed consumption and investment.
Labor markets also provide other economic indicators of the health of our economy. Post-WWII, overall employment grew 2 percent per year on average. In that period, a slight long-run downward trend occurred as population growth slowed and labor force participation steadied after the shift of women into paid labor. The average employment decline during previous recessions was -2.3 percent annually; the corresponding Great Recession rate was an annualized -3.4 percent, which held for an unusually long spell.
In previous recoveries, employment grew by an annualized 2.8 percent; in the current recovery, employment has grown 1.1 percent — barely keeping up with population growth.
Despite slow recovery, real estate markets are showing signs of life. Wisconsin mirrors national trends: prices have firmed and started to grow, sales are up, the number of underwater borrowers is down, the foreclosure backlog is clearing, and inventories are better. Consult the charts and accompanying home sales reports at www.wra.org/HousingStatistics for more.
Garrison Keillor was wrong about the Midwest
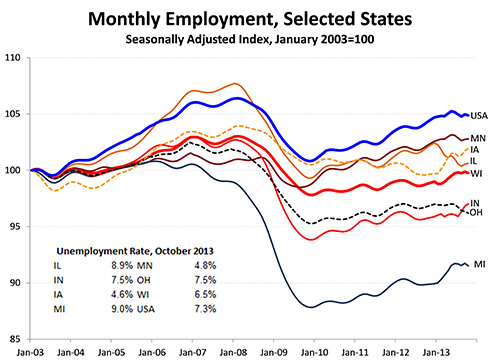
Sadly, his “all the children are above average” can’t apply to the Midwest. I argue that, at least in recent times, we’ve often been below average. I’ll begin with employment since it’s probably the most-watched economic indicator. Let’s examine a decade of data: by starting in 2003 after the “Tech Wreck” 2001 recession, we can see the boom, bust and the recovery. (Figure 1.)
FIGURE 1:

Since January 2013, employment jumped a bit as Figure 1 shows, but Wisconsin still trails behind the national average. Figure 1 highlights other Midwest states, and Wisconsin is the middle of the pack among these comparators. These states all fall behind the national average, though; while many factors can cause this lag, one reason is because Midwest states have slower-than-average population growth. With all 50 states considered — chart available on request — population growth alone explains for almost half the observed variation in employment growth since 2003. For example, Texas’ employment grew at triple the rate of Wisconsin’s — not because of tax policy or Gov. Perry’s world tours, but largely because Texas attracts more immigrants from within and outside the U.S. than Wisconsin.
Michigan and Rhode Island tied for worst; both saw employment declines over the decade, much worse than their population growth would suggest. And Minnesota performed a bit better than its population growth predicted. Look for more on this subject in 2014 from the Graaskamp Center.
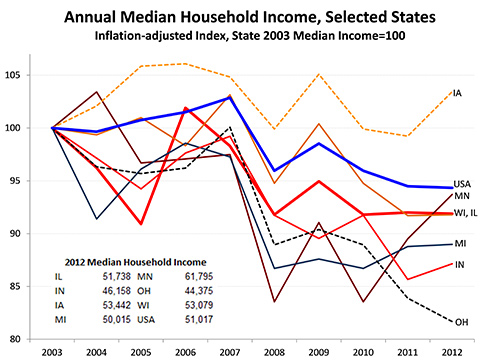
Figure 2 presents the U.S. and Midwest states’ changes in real median household income. Ethanol-fueled Iowa outpaced the U.S. in household income growth, while Wisconsin and the rest of the Midwest lag. Other states not shown — North Dakota, Oklahoma, Texas and Wyoming — benefited from the commodity boom and saw gains. But for most of the country during the past decade, the by-now well-known story is that household and family incomes have stagnated except at the top of the income distribution.
FIGURE 2:

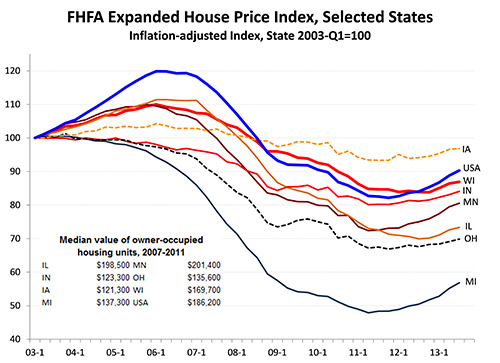
Figure 3 shows the decade’s performance of house price indexes from the Federal Housing Finance Agency. Several patterns are immediately apparent. Like most of the Midwest, Wisconsin did not boom or bust as much as the average. Other states not shown — Arizona, California, Florida and Nevada — experienced larger booms and busts than in Figure 3. Iowa was the only Midwest state with stronger house price growth than national averages over the past decade, albeit in addition to income growth, Iowa started from the lowest base house price. Unfortunate Michigan had the biggest bust with no boom, with Ohio not far behind. Wisconsin’s housing markets had problems but performed better than most states.
FIGURE 3:

2014 outlook: “meh” or “wha”?
Wha: “The opposite of Meh.” — Urban Dictionary
In 2010, PIMCO’s CEO Mohamed El-Erian popularized the notion of a “new normal:” that the historic 2 percent per capita GDP growth — and 3 or 4 percent recoveries — was over and the last few years of experience presages a new, more modest era.
Some academic economists like Tyler Cowen and Robert Gordon weighed in, more or less supporting El-Erian’s arguments: the “low-hanging fruit” of big technologies like electrification, public utilities and the automobile are mostly used up; new IT and Web-based technologies are small by comparison; and the gains from women entering the workforce are largely realized.
Perhaps these pessimists are correct. I’m not yet convinced. Over my three dozen years in economics, I’ve seen many claimed “paradigm shifts” evaporate. Ironically, I take comfort in the Reinhart and Rogoff analysis that shows balance-sheet recessions associated with slow, weak recoveries. “Slow and weak” is better than a permanent “new normal”: as repairs continue, we’ll likely see growth pick up back to the old normal.
2014 negatives: Our trade partners, especially in Europe and China, face risks. Significant political risks in the Middle East, Central Asia and Eastern Europe could spill into the global economy’s detriment. Also challenging labor markets are long-term unemployment levels and declines in labor force participation. Cuts to unemployment insurance, food stamps and housing vouchers would increase labor force participation, although minimally; thus such cuts would be negative for the economy now. The fact that much of the middle class has yet to share in this modest recovery is not what we want in the real estate industry: our markets span all Wisconsinites, all Americans.
2014 mixed messages: The current health care imbroglio includes risks with resetting 17 percent of the economy, but also opportunities if we succeed in moving health care from around the neck of employers and bend the health care cost curve. Political dysfunction, especially but not limited to Congress, raises risks of another round of debt ceiling nonsense. Some signs, such as the recent two-year budget agreement, indicate that adults are again taking charge. The Fed will have to stay on top of its game under new chairman Janet Yellen; it will presumably start the “taper” in the New Year, begin to manage the exit from its $4 trillion balance sheet that includes many mortgage-backed securities, and face new regulatory challenges and responsibilities. And while they’ve provided a lifeline to housing, we still haven’t figured out how to deal with Fannie and Freddie.
2014 positives: Inflation remains low — which is good, but gives the Fed and others more freedom to manage the financial side of the recovery. Interest rates, while rising recently, remain low, and capital flows are growing. Shadow inventory, including potential inventory from underwater mortgagors, has improved. Most of all, hiring is picking up and unemployment is declining.
In 2014, my best forecast is that as momentum builds in the labor market and balance sheets continue to repair, we’ll move from a “meh” into a solid “wha” economy. The post-2006 correction in housing prices brought us to sustainable levels in most markets, although at great cost to our economy and our industry. History suggests that markets like Wisconsin’s can sustain modest annual price increases moving forward. Over the next several years, if prices in Wisconsin and in the U.S. get back to that sort of sustainable growth, we’ll be in good shape. On the other hand, if we string four or five years of real annual price increases of 3 or 4 percent or more, as in the early 2000s, then we know the origin of the next recession. I doubt we’ll see this; lenders and regulators have learned some hard lessons, and we’ll need to take them to heart in the decades ahead.
Suggested readings on the “new normal,” how balance sheet repair may be a reason for our slow recovery, data for additional states, and details of data sources for the charts, are available from the author at smalpezzi@bus.wisc.edu. See also smalpezzi.marginalq.com. Stephen Malpezzi is a Lorin and Marjorie Tiefenthaler Professor at the James A. Graaskamp Center for Real Estate at the Wisconsin School of Business.