We have a strong and growing economy bolstered by improving confidence that these positive trends will continue. We continue to have mortgage rates near historic lows, yet existing home sales have been either growing slowly or flat. So why are we not selling more homes? The answer is inventories, which have been consistently shrinking over the past several years. Like many market-related phenomena, this problem has resulted from fundamental issues of supply and demand. In this article, we explore recent trends in inventories as well as the causal factors in play. We then speculate as to what the near and more distant future will likely hold.
How much inventory is enough?
Economists answer this question in a relatively straightforward manner: There is enough inventory when the number of homes available for sale for a given time period is roughly equal to the number of homes that buyers are willing to purchase during that same period. When this situation exists, economists characterize the housing market as being in a state of “equilibrium.” An important feature of an equilibrium housing market is that we would expect home prices to grow at roughly the rate of inflation, on par with the general movement of prices in the economy. On the other hand, markets are said to be in “disequilibrium” when there are either too many sellers given market demand — such as in a buyer’s market where market prices are pushed down relative to the inflation rate, or when there are too many buyers given market supply — such as in a seller’s market where housing prices grow in excess of the rate of inflation.
Past and current inventory
There are a number of ways to measure inventory, and one of the most useful is to derive months of supply. Specifically, this measure compares the available homes for sale to the average monthly sales over the past 12 months to determine how many months it would take to liquidate the existing inventory, assuming no new homes were constructed. While not a perfect measure, it effectively captures supply relative to recent levels of demand. A rule of thumb is that six months of available supply reflects a balanced or equilibrium housing market. In contrast, inventory below six months represents a disequilibrium market in which sellers exercise considerable market leverage. The lower the months of supply, the stronger the seller’s market. Likewise, when inventories exceed six months, this is indicative of a buyer’s market, and buyers are likely to obtain more concessions from sellers with a greater amount of inventory.
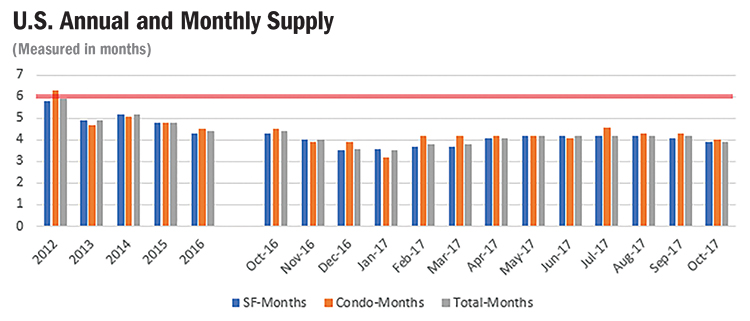
The chart below demonstrates that at a national level, the market has effectively been in a seller’s market state since 2013 and inventories have been consistently falling since 2014. The monthly data reveal a regular seasonal pattern in months of supply, and national inventories actually fell below four months in October 2017.
Source: National Association of REALTORS®
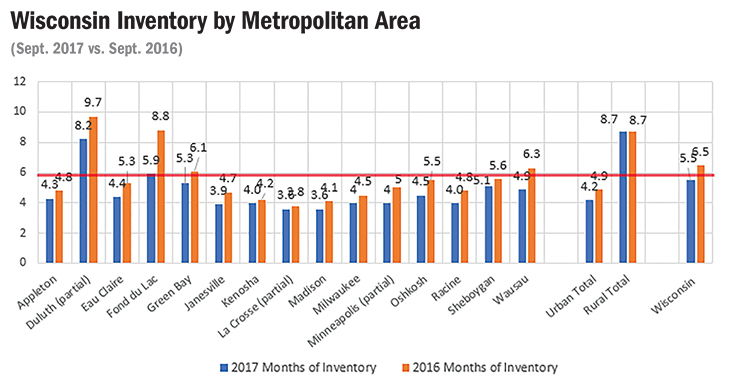
A review of Wisconsin inventory levels paints a similar picture with inventories continuing to tighten between 2016 and 2017. This is true statewide as well as for counties classified as metropolitan by the U.S. Census. Rural counties are unchanged comparing September 2017 to that same month in 2016. When contrasting urban and rural markets, rural counties have approximately twice the available inventory, with 8.7 months, compared to their metropolitan counterparts, which have 4.2 months. Thus, the urban markets have sellers in the driver’s seat, whereas buyers exercise far more leverage in the rural markets.
Source: Wisconsin REALTORS® Association
Consequences of tight inventories
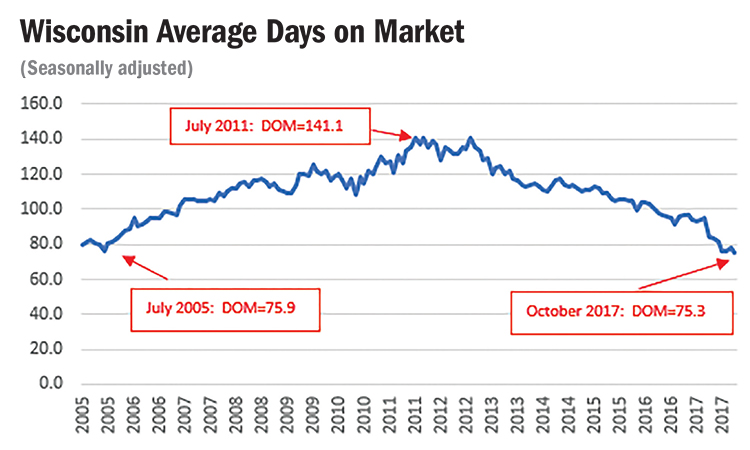
When housing markets have many potential buyers competing for a limited supply of homes, two things tend to happen: First, homes sell more quickly than they would when inventories are more plentiful, and second, home prices are pushed upward at well above the rate of inflation when inventories tighten. In the chart below, the seasonally adjusted days on the market (DOM) have consistently fallen since 2013 and are now at the lowest levels seen since the WRA recalibrated its data collection methods in 2005.
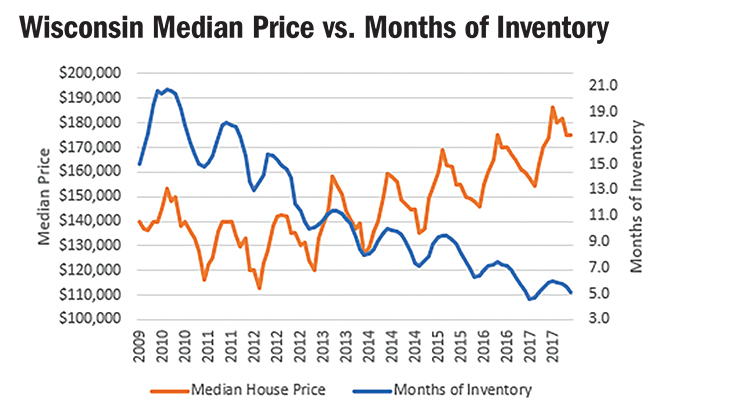
The chart below shows the median price of existing homes in Wisconsin plotted against the months of available inventory in the state. Both data series show distinct seasonal patterns, with prices and inventories rising during the peak sales periods in the late spring and summer, then falling during the winter months. However, median prices also show a consistent pattern of annual price appreciation beginning in early 2012. Also at that time, inventories moved in the opposite direction, falling from 14.2 months in March 2012 — which was the month where prices first began increasing relative to the same month in the previous year, to just 5.1 months in March 2017. Over that 60-month period, median-priced homes in the state rose from $123,000 to $163,500, which represents a 32.9 percent increase in home prices. Over that same period, the Consumer Price Index (CPI) rose by just 6.5 percent. Thus, median housing prices in the state rose at just over five times the rate of inflation.
Source: Wisconsin REALTORS® Association
Strong demand strains inventory
Housing markets have tightened as a result of strong demand pressures combined with weak supply response. On the demand side, the economy has picked up steam over the past couple of years, leading to healthy job growth in the state. Between October 2016 and October 2017, total nonfarm jobs grew by 42,400, with 13,000 new jobs in manufacturing over that period. The Wisconsin unemployment rate remained below 4 percent throughout the first 10 months of 2017, and it was just 3.4 percent in October. This puts the Wisconsin rate below the national rate of 4.1 percent in that same month. Economists typically consider unemployment rates at or below 4 percent to reflect full employment. It is important to note that the Wisconsin unemployment rate has fallen over the past year even as the state labor force grew by more than 43,500 workers.
Source: Wisconsin REALTORS® Association
In addition, the 30-year fixed-rate mortgage stood at just 3.90 percent in October, which is only about 0.6 percent above the all-time low of 3.35 percent seen in late 2012. This low rate is a consequence of the Federal Reserve Bank’s reluctance to aggressively raise short-term interest rates, and longer term, by the Fed’s success in keeping inflation under control. Indeed, the CPI has generally grown in the range of 2 percent to 4 percent since the early 1990s.
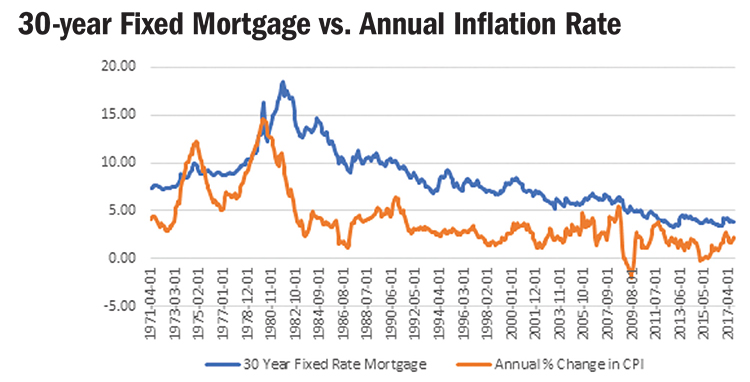
Source: Freddie Mac; Bureau of Census
Finally, household growth has increased post-recession with the aging of the millennial population. Specifically, the Joint Center for Housing Studies at Harvard University1 estimates that households increased by somewhere between 960,000 and 1.2 million over the 2013-2015 period. Millennials now represent the largest generation in U.S. history. Still, their movement into owner-occupied housing has been limited by relatively low income levels, delays in marriage and childbearing, and relatively high student debt loads. According to the 2017 Profile of Buyers and Sellers conducted by the National Association of REALTORS®, first-time homebuyer rates stood at 34 percent of all housing sales. This compares to a long-run average of 39 percent. Moreover, the Joint Center also points out an increase in the share of older homeowners. Specifically, the Joint Center noted in the 2017 State of the Nation’s Housing report that those households in the 55-and-older category had a greater share of homeownership in 2016, at 54 percent, than they did in 2001, at 41 percent.
The relatively weak supply response
There are three primary sources of housing supply in the state: foreclosed properties, new construction of residential housing, and the existing homes listed on the market. A review of Wisconsin foreclosure activity reveals that the state is back to the levels last seen in the early 2000s. This is certainly good news for those directly affected by foreclosure as well as homeowners who saw their property values fall as a consequence of the housing meltdown, but the low foreclosure supply has eliminated a significant source of housing supply that existed in the immediate period after the recession.
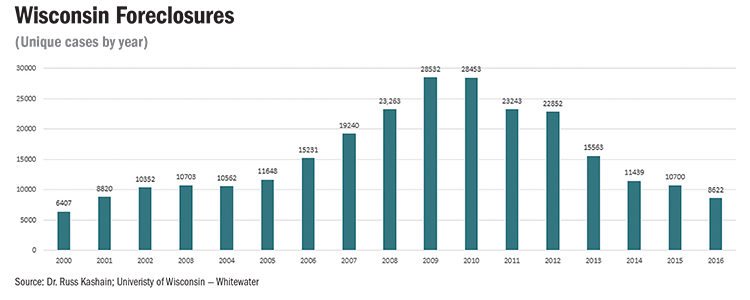
Source: Dr. Russ Kashain; University of Wisconsin-Whitewater
Residential construction has helped to augment the state housing supply, but the pace of growth has been muted by labor shortages in the trades as well as restrictions on land development in some areas of the state. These shortages and restrictions have driven up land prices.
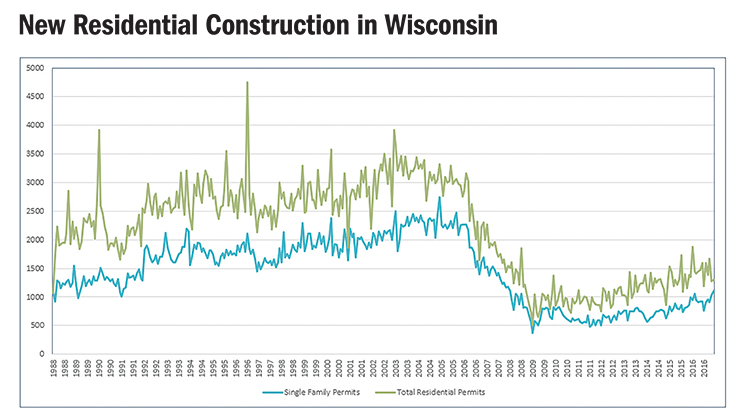
Source: U.S. Census Bureau; Federal Reserve Bank of St. Louis
Finally, many baby boomers who normally would have transitioned to different housing arrangements as personal circumstances changed instead resisted making this transition during the financial crisis. By aging in place, these homeowners were able to avoid housing capital losses that would have resulted from the housing price correction. Indeed, a research study2 conducted for Harvard’s Joint Center in 2011 documented that older homeowners ages 55 years and older were much less likely to move as a result of the housing downturn than younger homeowners. One way of thinking of the impact of a delayed transition for baby boomers is that the supply side of the market actually lost a nontrivial portion of a half-generation of sales, given that we are now 10 years beyond the beginning of the Great Recession. It will take time for that inventory to replenish.
So what's next?
Eventually, the inventory problem will resolve itself as both the demand side and the supply side of the housing market adjust to higher market prices. That adjustment is what Adam Smith, the founder of modern-day economics, described as the “invisible hand” of price coordination3. Housing prices have been rising at well above the rate of inflation, which serves as a signal to both buyers and sellers. On the buyer side, housing affordability is slipping as home prices and future interest rates both increase. This will delay home purchases by some households, which lowers some of the demand pressure. Of course, that will be muted by the fact that millennials have delayed but not eliminated their demand for single-family housing. As they enter into parenthood, their demand for living space will increase; translation: they will move out of small apartments and into single-family homes. On the supply side, these rising prices provide an incentive for current owners to sell their homes, especially those considering relocating, which will effectively increase supply. The increase in supply and reduction in demand pressure will mitigate the inventory problem and eventually moderate the price increases. A second factor that will improve inventories is the continued growth of the new construction market. The current trade labor shortages should decline over time as those occupations offer the promise of higher wages. We expect the growth in new construction of single-family homes to accelerate over the next one to two years. And finally, while the baby boomer generation has benefited greatly from improved health care and medical technology, they have not stopped the passage of time. The oldest boomers are now 70 years old, and health-driven housing transitions are inevitable. Those properties will ultimately find their way onto the market and will have a significant impact on single-family inventories.
Of course, the $1 million question is how long it will take for these adjustments to take place. Economic forecasting is a dangerous practice, which led one commentator to note that “it’s like climbing a flagpole; you get a lot of attention but you leave your most embarrassing side exposed.” Without going too far up that flagpole, I expect some improvement in the inventory over the next year, but only modest increases, for example, less than a 5 percent improvement. The largest source of supply is an increase in listings of existing homes, which is primarily driven by the demographics of the baby boomers.
Thus, we should expect more substantial relief the further we go into the future. It should be more noticeable in three to five years.
David Clark, Ph.D., is a professor of economics at Marquette University and serves as a consultant for the WRA in the analysis of home sales data as well as in the preparation of the monthly Wisconsin Housing Report. For more information, contact Dr. Clark at C3 Statistical Solutions at 414-803-6537.
1 Joint Center for Housing Studies of Harvard University, 2017 State of the Nation’s Housing
(http://www.jchs.harvard.edu/research/state_nations_housing).
2 “Housing Turnover by Older Owners: Implications for Home Improvement Spending as Baby Boomers Age into Retirement,” George Masnick, Abbe Will and Kermit Baker, March 2011, W11-4.
3 “An Inquiry into the Nature and Causes of the Wealth of Nations,” Adam Smith, 1776.