Prior to the so-called “Great Recession,” the housing market was red hot, with conditions of very strong demand outpacing existing supply and driving prices up well above the rate of inflation. Now, nearly 10 years later, we find ourselves in similar circumstances with strong demand, limited supply and prices growing at more than twice the annual pace of inflation. This begs the question: Are we on the cusp of another recession, and if so, is it likely to rival the Great Recession in its severity?
In this article, we will review the circumstances that led up to the Great Recession. Next, we will then assess the current state of the national and state economies and the housing market. Finally, we’ll examine the likelihood of a recession over the next 12 months and the likely implications of the economy on the Wisconsin housing market in 2019.
The Genesis of the Great Recession
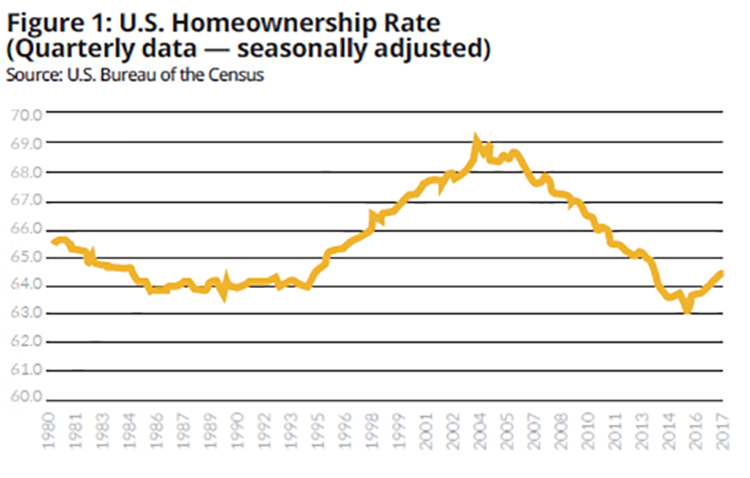
It’s important to note what precipitated the Great Recession in the first place. Loose underwriting standards led to a significant run-up in home prices as homeownership became a reality for millions of buyers. Homeownership rates, which had stayed in the range of 63.7 percent to 65.6 percent from 1980 to the mid-90s, steadily grew over the next decade, peaking at 69.4 percent. While homeownership can have important societal benefits — namely, neighborhood stability — it carries potential risk as well, and those risks played out during the recession. The surge in housing demand included many buyers with very marginal credit scores. These buyers only secured financing through short-term teaser rates on subprime loans, which were adjustable rate mortgages after one year. Subprime mortgages were bundled into financial instruments known as mortgage-backed securities, and many of our largest commercial banks had these assets in their portfolios.
As long as housing prices continued to rise, all was well. Even homeowners who found themselves in financial difficulty could easily sell their properties, often at well above the price they paid, and avoid financial losses. Unfortunately, many owners were taking out home-equity lines of credit on their homes, converting the equity that existed on paper into cash. The resulting consumer spending fueled the economy but had created a house of cards that all came crashing down when home prices finally peaked in late 2006 and early 2007. The most vulnerable homeowners began to default on their loans, the value of mortgage-backed securities plummeted, and some of the most respected commercial banks — including Lehman Brothers — became insolvent.
The housing price bubble
The housing price impacts were dramatic, especially in some key markets in the western and southern areas of the country where there had been significant speculative buying and selling of homes. To gauge the changes in prices, we need an apples-to-apples comparison of housing prices over time, and we can get this using a so-called Constant Quality Housing Price Index created by the Federal Housing Finance Agency (FHFA). The FHFA is the agency that regulates Fannie Mae and Freddie Mac, and it uses a statistical methodology to create this index. Think of the Constant Quality Housing Price Index as showing what a house with the same qualitative features — for example, a 3-bedroom ranch with 2.5 baths on a quarter acre lot in the same location in the suburbs — would sell for at different points in time. Specifically, the index shows how a property price would evolve if the same property were resold every three months from 1991 to today. The FHFA index (Figure 2) clearly shows the housing bubble, easily identifiable in the 2006-2007 range. If we look at the entire United States, consider a home selling for $100,000 in 1991, in which the index takes on a value of 100. That home would have appreciated 124 percent over the course of 12 years, for about $224,000 by the end of 2003, amounting to an appreciation rate of about 4.8 percent per year. However, between 2004 and early 2007, prices rose at an annual pace of about 7.1 percent. When the bubble burst, housing values dropped about 21 percent in just over four years.
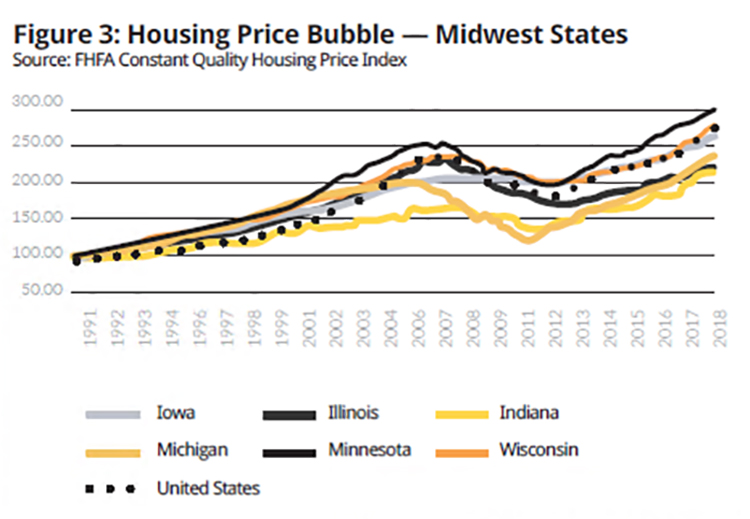
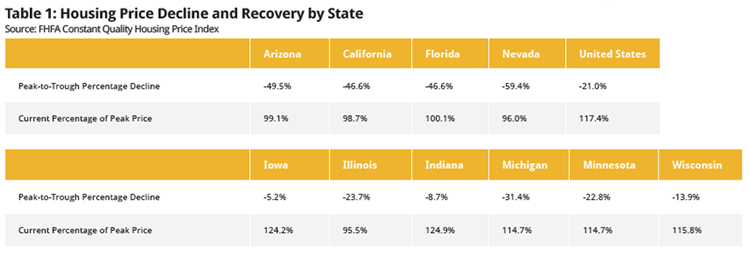
The peak-to-trough decline in home values was even more pronounced in four heavily populated states in the south and the west. Specifically, following the peak in home values, values dropped between 46 percent and 50 percent in Arizona, California and Florida, and they fell by a massive 59 percent in Nevada. While the impact in the Midwest was less pronounced, it was still significant, as seen in Figure 3. The loss of housing values was more pronounced in Minnesota, Michigan and Illinois than it was in Wisconsin, Iowa and Indiana.
Magnitude of the Great Recession
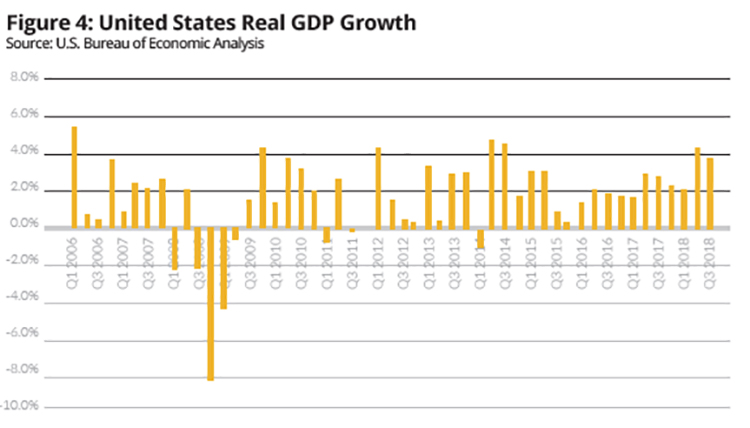
The recession that followed the bursting of the housing bubble was unique in both its length and its depth. According to the National Bureau of Economic Research, the Great Recession was 18 months in duration, officially beginning in December 2007 and ending in June 2009. By post-war standards, this was our longest recession. The previous 10 recessions lasted 10.4 months on average, and the recessions in the early 1990s and the early 2000s were quite mild by comparison, lasting only eight months each. As Figure 4 shows, real GDP growth declined at an annual pace of 8.4 percent in the fourth quarter of 2008, and it fell by 4.4 percent in the first quarter of 2009. In short, this was a very long and very deep recession, and the job market impacts were severe.
The economy lost 8.7 million jobs during the recession and saw a sizable spike in the unemployment rate. According to the U.S. Bureau of Labor Statistics, the unemployment rate more than doubled between November 2007 when it stood at 4.7 percent, and October 2009 when it peaked at 10 percent. The mean duration of unemployment rose from 17.3 weeks just before the recession started to just over 40 months in September 2011.
The post-recession recovery in the housing market
Nearly 10 years after emerging from the Great Recession, most state housing markets have fully recovered. Table 1 shows both the peak-to-trough decline in home values during the Great Recession as well as the housing price recovery, post-recession. For the U.S., home values dropped 21 percent as a result of the recession, but they have now fully recovered; and as of the third quarter of 2018, home values are 17.4 percent above the peak values prior to the recession. The picture for the upper Midwest mirrors what has taken place at the national level. In contrast, the four worst-case home markets are at best reaching peak levels. In fact, Nevada values remain 4 percent below their peak, which occurred in early 2006.
Where are we now?
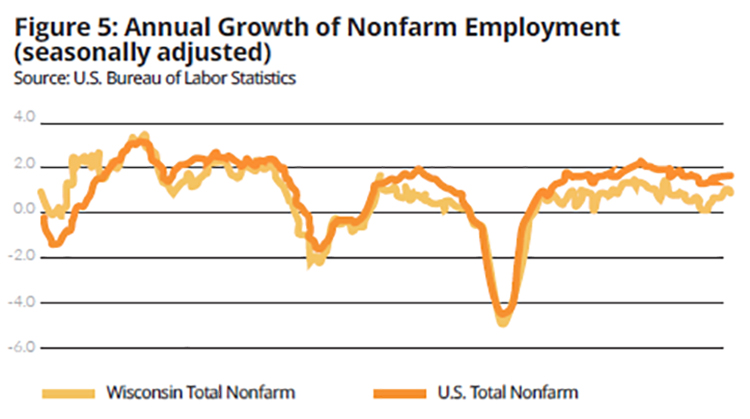
A rule of thumb often used by economists is that recessions occur when we have two straight quarters of negative real GDP growth, also known as inflation-adjusted growth. While there have been exceptions, most recessions have included at least two quarters of negative growth. As of the third quarter of 2018, both the U.S. and Wisconsin economies appear to be growing at a robust pace. The second quarter of real GDP growth was 4.2 percent, and the third quarter growth is estimated to be 3.5 percent. It’s clear the economy continues to expand, which has fueled employment growth and drove both the state and national unemployment rates to record-low levels. Nonfarm jobs have experienced positive growth since August 2010 (Figure 5). Indeed, over the last year, the U.S. economy has created approximately 2.5 million nonfarm jobs between October 2017 and October 2018, and Wisconsin has created 35,200 nonfarm jobs over that same period.
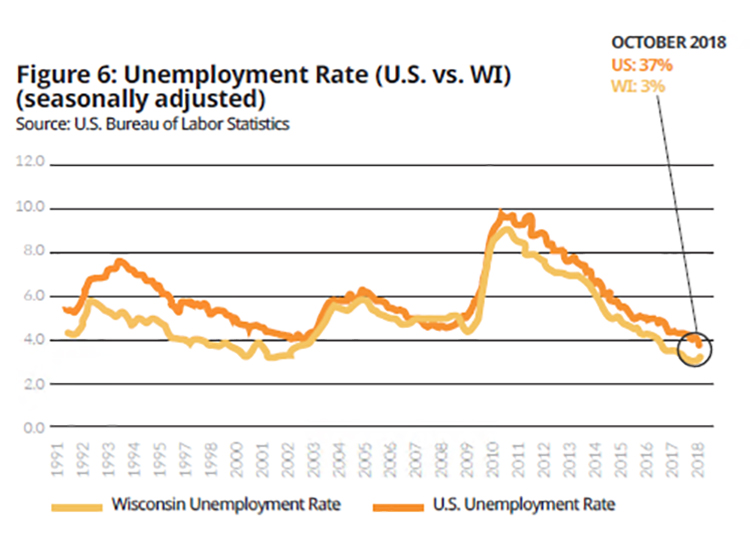
The U.S. unemployment rate dropped to 3.7 percent in September 2018 and remained at that level in October (Figure 6). Likewise, the Wisconsin unemployment rate dropped to 2.8 percent in April 2018 and has remained at 3 percent over the August-through-October time period. Both of these reflect a labor market at full employment by economic standards.
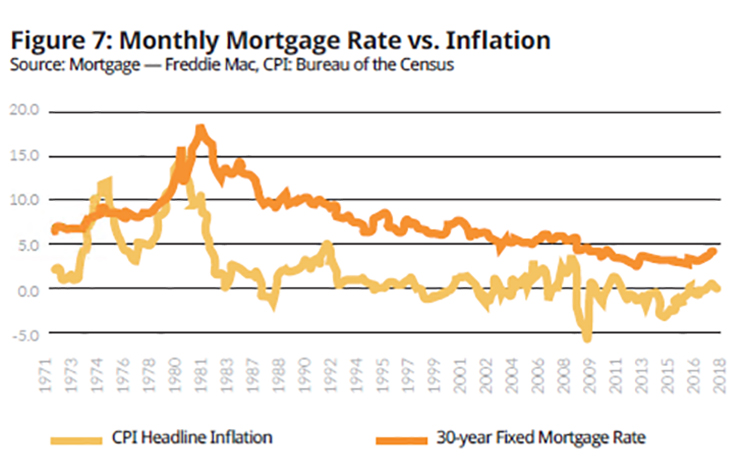
With such a tight labor market, one might expect inflation to be a growing problem. Indeed, the U.S. Federal Reserve Bank has raised short-term rates to keep inflation in check. As of October 2018, headline inflation was at 2.5 percent and core inflation, which removes the more volatile food and energy sectors, stood at 2.1 percent. Both inflation values are near target levels of inflation for the Fed. Since inflationary expectations are embedded in long-term mortgage rates, keeping inflation under control will help to keep mortgage rates low. Indeed, when mortgage rates topped 18 percent in October 1981, inflation was in excess of 10 percent, as shown in Figure 7. Thus, although the 30-year fixed-rate mortgage inched upwards in 2018, it remained below 5 percent as of October 2018.
The tight labor markets in the state have put upward pressure on wages and as a result, the WRA estimates that median family income has risen 4.39 percent over the October 2017-October 2018 time period and the growth in income combined with relatively lower mortgage rates has kept demand for housing strong. These strong demand conditions would be expected to stimulate sales. Unfortunately, sales have been severely constrained by tight supply throughout 2018, so much so that only 4.5 months of supply was available in October. This is well below the level of six months, which is typically considered a balanced market. Hence, year-to-date sales through October 2018 have trailed 2017 sales over that same period by 2.2 percent. The combination of strong demand and tight supply has put strong upward pressure on home prices. Year-to-date through October, prices rose 6.4 percent relative to the first 10 months of 2017.
Is a recession on the near-term horizon?
One thing that is certain is that economic contractions always follow expansions, which is why economists refer to this process as a business cycle. We’ve had 11 of these cycles since WWII. So the question isn’t “if” a recession will occur, but rather “when” the economy will begin to contract. An equally important question is “how long and how deep” will be the next recession. The longest U.S. post-war expansion was during the 1990s, and it lasted exactly 10 years. The current expansion, if it continues, will hit that mark in May 2019. Reading the economic tea-leaves is always challenging, but I believe that a recession is unlikely in 2019, and so I expect the current expansion to establish a new post-war record.
Why is a 2019 recession unlikely? A primary reason is that many of the conditions that typify the start of a recession are not yet in place. There are a number of so-called leading economic indicators that are tracked by the macroeconomic research firm Conference Board that precede a downturn, and while these indicators have been growing more slowly in recent months, they are not yet moving downward, suggesting that the expansion will continue in the near-term. In addition to the Leading Economic Index, the Conference Board also tracks a set of Coincidental Economic Indicators that move in concert with the economy as well as a set of Lagging Economic Indicators that don’t move downward until after the economy has begun to decline. The most recent Conference Board report, issued on November 21, 2018, indicated that the Leading Economic Index, Coincidental Economic Index and Lagging Economic Index are all rising.
Second, one of the leading economic indicators is the movement of stock indices, and there is no doubt that we have seen significant volatility including a recent sell-off on the major U.S. Stock Indices. However, much of the volatility is resulting from uncertainty in U.S. trade policy with some of our most prominent trading partners. Some of these trade disagreements have been resolved, and there appears to be some progress with one of our largest trading partners, China. To the extent those negotiations result in a trade agreement will serve to moderate the stock market fluctuations.
Finally, inflation has yet to become a significant problem. Part of this may be due to the moderation in energy prices as a result of robust domestic production in that sector. However, the generational shift resulting from the retirement of the baby-boom generation and its replacement with younger, and lower-paid, millennials has kept wage pressures lower than would otherwise be the case. This suggests there is more room for the economy to expand. In fact, the most recent Survey of Professional Forecasters conducted by the Philadelphia Federal Reserve Bank suggests that both headline and core inflation values are expected to remain low through 2020. The survey also puts the risk of a negative quarter of real GDP growth at less than 20 percent through the third quarter of 2019.
One last point. When the next recession does hit, it will not be nearly as long or deep as the Great Recession. The Great Recession was a perfect storm resulting from excesses in the housing industry that precipitated a financial crisis. Regulatory changes in the aftermath of that recession effectively tightened up underwriting standards, which will make the next recession more like the two that preceded the Great Recession; relatively short in length and relatively shallow in depth.
Expectations for the housing market
There are a number of factors that suggest the housing market will moderate over the next 12 months. Weak inventories have been a problem for a couple of years now and will remain a problem in 2019. Weak supply and solid demand will continue to put upward pressure on prices and will further reduce affordability. Figure 8 plots the monthly Wisconsin Housing Affordability Index since 2009. The index shows the fraction of the median-priced home that a borrower with median family income can afford to buy, given that the borrower has a healthy 20 percent down payment and a 30-year fixed-rate mortgage financing the loan on the remaining 80 percent of the sales price.
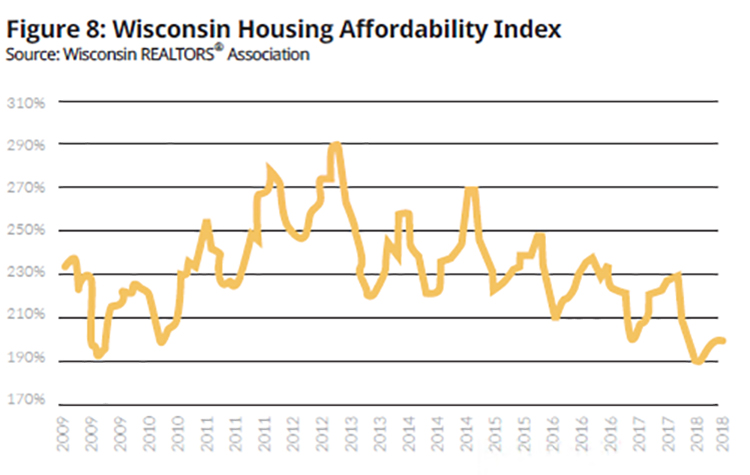
We can see that the affordability index tends to follow a regular seasonal pattern, peaking during the slower seasons for sales and then decreasing during the peak sales period each year when prices tend to rise. However, since housing prices bottomed out in early 2012 and mortgage rates hit their low point later that year, there has also been a downward trend in affordability. I expect that to continue throughout 2019 as prices will continue to rise, and the Fed will raise short-term interest rates one to two times over the course of 2019. Ultimately, demand pressure will begin to moderate in 2019, and this will help move Wisconsin toward a more balanced housing market. However, that point of balance where the state is neither a buyer’s nor a seller’s market is more likely to occur in 2020 than 2019 since inventory adjustments will evolve slowly over the next one to two years.
David Clark, Ph.D., is a professor of economics at Marquette University and principal at ECON Analytics, LLC, and serves as a consultant for the WRA in the analysis of home sales data as well as in the preparation of the monthly Wisconsin Housing Report. For more information, contact Clark at 414-803-6537.