Sitting in January 2020, no one could have foreseen the turmoil that was to unfold in the spring. We were experiencing the longest economic expansion in U.S. history, and while there were some preliminary signs of slowing in the economy, most economists were anticipating continued expansion into the spring. Instead, the COVID-19 pandemic led to a massive reduction in economic activity and an unprecedented quarterly decline in real inflation-adjusted GDP. In contrast, after a very short and steep decline in Wisconsin home sales, July ushered in a sharp increase that continued into the latter part of the fall. This article offers a review of what transpired both in the economy and in the housing market in 2020, and then considers the future path of both areas in 2021.
The national economy and the business cycle
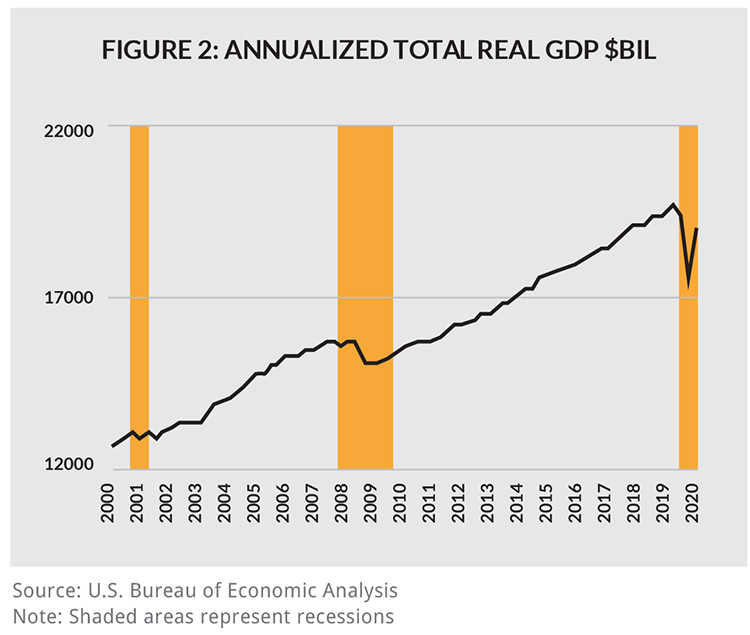
The U.S. economy peaked in February 2020 and entered the most recent recession in March 2020 after a record of 128 months of economic expansion, according to the National Bureau of Economic Research (NBER), which is the organization that determines the official dates that recessions begin and end. The expansion had been the longest in history, exceeding the previous record expansion, which was April 1991 to March 2001, by eight months. The 2020 recession has been described as a “pandemic-induced recession,” although some indicators showed that the economy had already begun to slow before the declaration of the national emergency in mid-March. As seen in Figure 1, the subsequent economic lockdowns in March caused the economy to contract 5% in the first quarter of 2020, followed by a massive 31.4% contraction in the second quarter. The second quarter decline is the single-largest quarterly decline in U.S. history, and it was followed by the largest quarterly increase on record of 33.1% in the third quarter. It is important to point out that these growth measures compare the annualized growth extrapolated for the previous quarter, so the third quarter growth is off a significantly depressed second quarter.
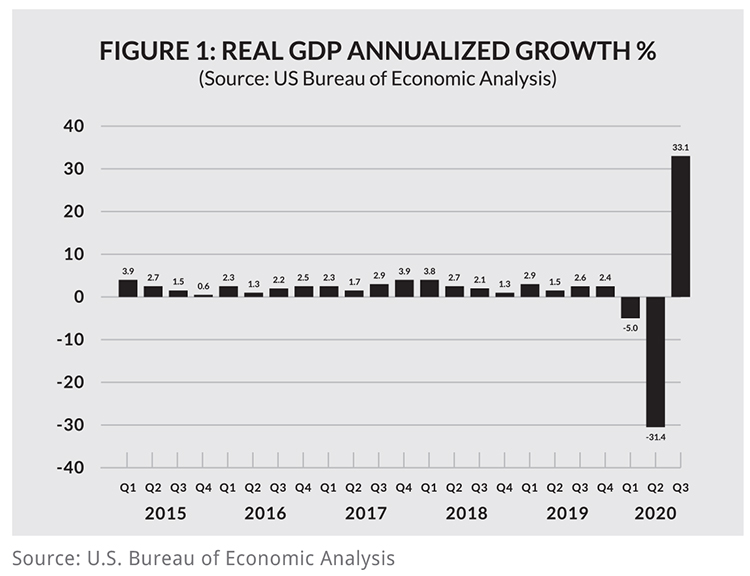
Several of the regional federal reserve banks engage in a process called “nowcasting” to predict the current quarterly growth of the economy by looking at preliminary data that comprises real GDP. There is preliminary data on consumption, investment activities, industrial output, trade levels and a variety of other components of real GDP. The most prominent regional fed bank engaged in nowcasting is the New York Federal Reserve Bank. Its most current estimate when this article went to press is that the economy expanded in the fourth quarter of 2020 but at a moderate pace of approximately 2.5%. In addition to growth in real GDP, the NBER evaluates a number of key economic indicators — including personal consumption expenditures, industrial production, personal income minus the value of income transfers, and nonfarm employment — when determining the end of a recession. All these measures are indicative of ongoing improvement of the economy.
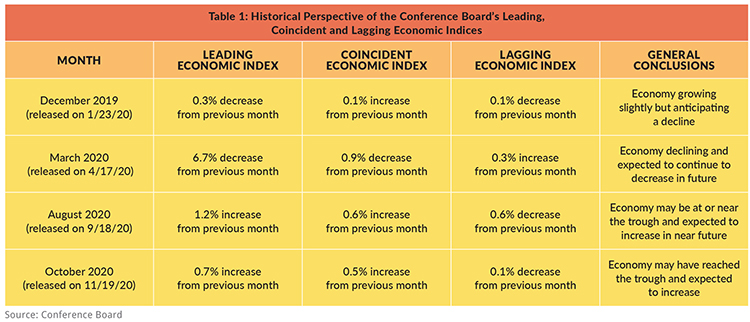
Economists have also developed barometric indices in an attempt to determine where the economy is in a business cycle. A number of indices have been developed by the Conference Board, a nonprofit organization funded through private donations from members including many of the companies on the Fortune 500. The Conference Board maintains and distributes numerous economic indicators for the U.S. and other developed countries. Three of the most widely used U.S. indices are the Conference Board’s Leading Economic Index (LEI), Coincident Economic Index (CEI) and Lagging Economic Index (LAG). These three indices, each of which is comprised of a weighted average of various macroeconomic data that follows a cyclical pattern, are used collectively to assess where the U.S. economy is in the business cycle.
For example, the LEI data series will peak before the U.S. economy peaks, and it will bottom out before the U.S. economy reaches its trough. The CEI will follow a pattern that roughly mirrors that of the U.S. economy, generally peaking and reaching its trough near the same time as the national economy. Finally, the LAG series begins increasing after the increase in the national economy and reaches the bottom of the cycle after the national economy begins to grow. An important caveat is that these indices provide general signals of economic movements, but they are not designed to provide precise indications of turning points. The lead times can and do vary, as do the coincident and lag times. In addition, these indices are subject to revision as their underlying components are updated.
Table 1 on the next page provides an overall picture of an economy that was growing but probably nearing its peak in December, began declining in March, was likely nearing its trough in August and was potentially increasing in October. We cannot conclude from these indicators that the recession has definitively ended; that decision resides with the NBER. However, these indices do suggest that even if we are still in recession, it is likely winding down.
A record year for Wisconsin housing
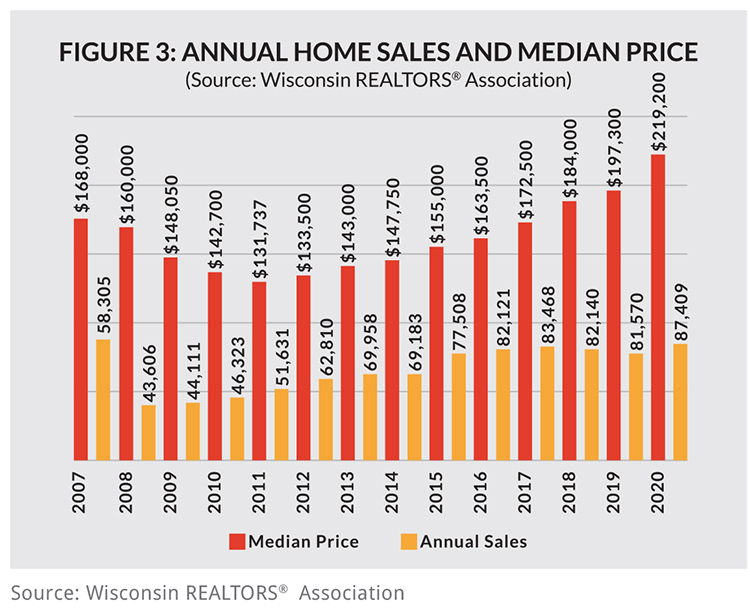
Wisconsin existing home sales and the median price of homes sold both reached record levels in 2020, as shown in Figure 3. Although December housing data was not available at press time, an extrapolation based on the 11-month trends and the share of homes typically sold in December indicates a solid path to a record year. Specifically, closed sales are expected to grow 5.7% compared to sales in 2019, and median prices are anticipated to be up 11% over that same period last year.
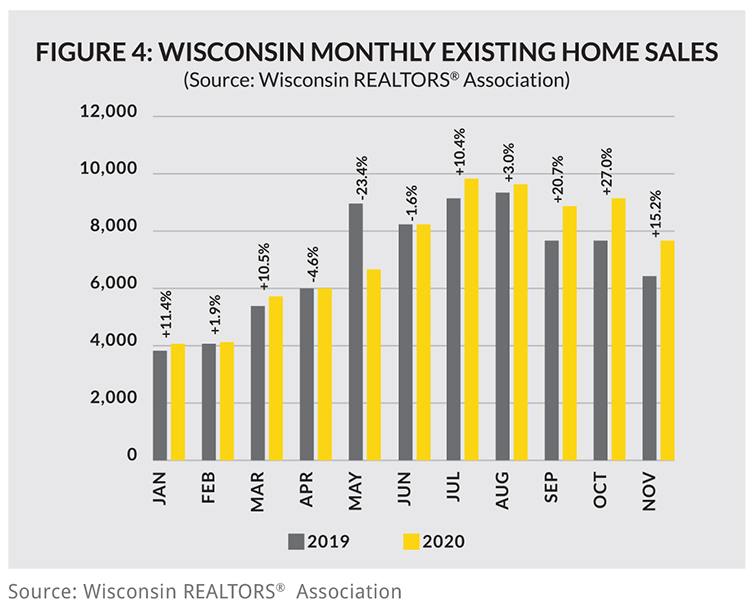
A review of monthly home sales in Figure 4 reveals dramatic shifts during 2020 as the economic lockdowns impacted closed sales in the spring, and the economy began to gradually reopen in the summer. The first quarter of the year was unaffected by the pandemic given the typical time between an accepted offer and a closing is generally in the range of four to six weeks. Overall, home sales in the first three months of 2020 outpaced the first quarter of 2019 by 8.1%. By the beginning of April, the statewide lockdowns had been in full force for two weeks, and this began to be reflected in closed home sales, which fell by 4.6% compared to the previous year. The largest negative impact was seen in May when sales were off the 2019 pace by 23.4%. After Gov. Evers’ second “Safer at Home” order was lifted in May, closed sales rebounded to end the month of June just 1.6% below June 2019 levels. There was a modest summer bounce, but more significant upticks took place in sales in the period from September to November, where sales were up 21.2% relative to that same three-month period in 2019.
Market drivers
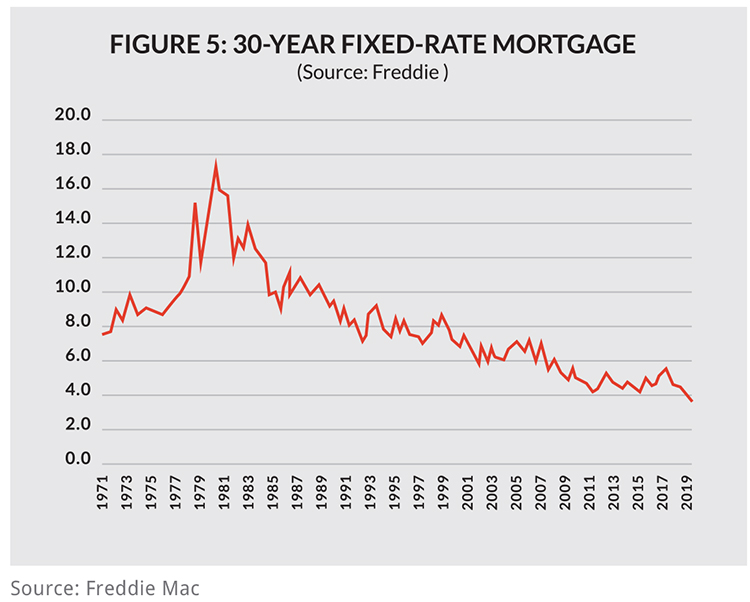
There were two major determinants of housing market activity in 2020; one on the demand side and one on the supply side. The primary factor influencing demand has been record-low mortgage rates. As Figure 5 shows, mortgage rates have generally been in the range of 3.5% to 4.5% since 2011. Prior to this year, the lowest 30-year fixed mortgage rate on record was 3.32% in November and December 2012. Following aggressive actions by the Federal Reserve in March that effectively lowered short-term interest rates to between 0.25% and 0%, long-term rates also began to move downward. The 30-year fixed-rate mortgage has fallen throughout 2020, starting at 3.62% in January, and falling to a new record low of 3.31% in April. Since that time, new record lows have been established every month through November. In November 2020, the rate was 2.77%, which is 93 basis points below its level from one year earlier. These record-low rates allow buyers to qualify for larger loans or lower their payments on a given loan amount.
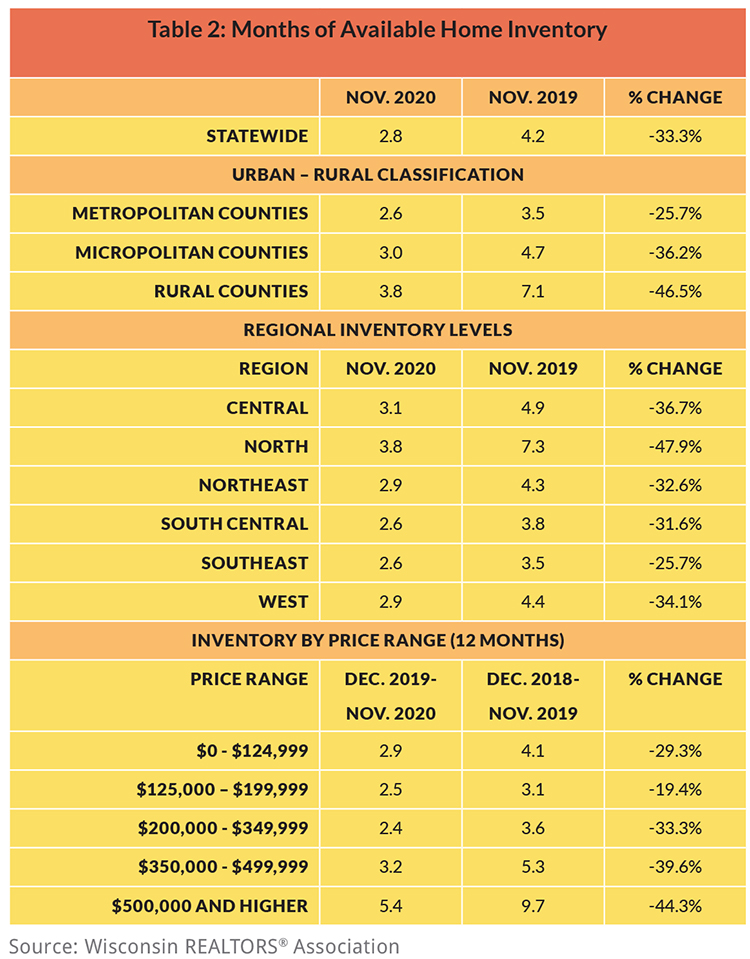
The supply side of the market has been dominated by very low inventories, and the situation worsened in 2020. The state inventory problems have been exacerbated by the spike in demand. Housing analysts classify a market as balanced when the inventory is sufficient to last six months, given the average monthly pace of sales over the most recent 12 months. Less than six months of supply signals a seller’s market whereas buyers have a market advantage when inventory exceeds the six-month benchmark. A key problem is that new listings of existing homes have not kept up with sales, and this has worsened the inventory problem. In November, total Wisconsin listings fell by more than 9,000 homes compared to November 2019, indicating a decline of 30.9%.
Table 2 shows that Wisconsin was classified as a seller’s market in November 2019 with just 4.2 months of supply, and the supply constraint has gotten much worse over the past 12 months. The state had just 2.8 months of supply in November 2020. The tightening of supply over the last year has created strong seller’s markets in every region of the state. The same is true for all urban/rural classifications with the tightest supply in the metropolitan counties, which are counties that comprise a metropolitan area that has a population of at least 50,000, followed by micropolitan counties, which are counties that comprise a metropolitan area that have a population between 10,000 and 49,999. Even rural counties are classified as strong seller’s markets. Likewise, the last 12 months have seen weak inventories in all price ranges, with the tightest supplies in the ranges between $125,000 and just under $350,000. Although 2020 will be a record year, the totals would have been even higher had inventories been stronger.
Significant price appreciation and affordability
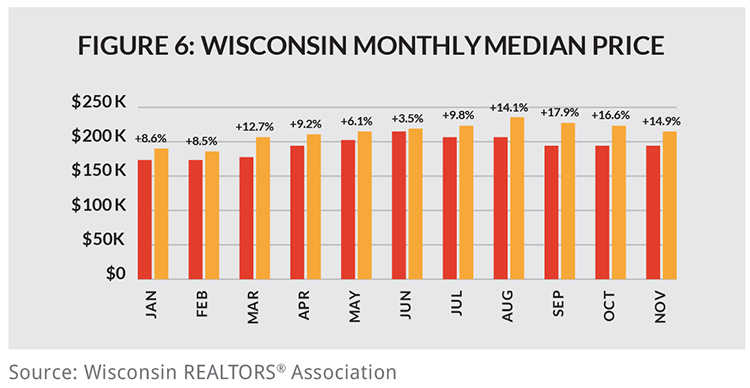
Anytime a market is characterized by strong demand and weak supply is a recipe for rising prices, and that is exactly what we have seen in the Wisconsin housing market in 2020. Median prices have grown on an annualized basis in every month of 2020; see Figure 6. The annual appreciation rate has been at or above 8.5% for every month except May, which was up 6.1%, and June, up 3.5%. Moreover, as demand intensified, prices grew at an accelerated pace. Specifically, the annual rate of increase ranged between 14.9% and 17.9% in the August-through-November period. By comparison, the annual rate of inflation has been very low by historical standards. Although inflation was running in the range of 2.3% to 2.5% in the first quarter, it has ranged between just 1% and 1.4% since July.
Wisconsin’s strong price appreciation would be expected to reduce housing affordability, but this has been mitigated by the decline in mortgage rates. The Wisconsin Housing Affordability Index shows the portion of the median-priced home that a hypothetical qualified borrower with median-family income can afford to purchase, assuming a 20% down payment and the remaining balance financed with a 30-year fixed-rate mortgage at current rates. Since home prices follow a regular seasonal pattern, so too does the index. As seen in Figure 7, the Wisconsin index steadily fell over the 2015-2018 period before flattening somewhat in 2019 and 2020.
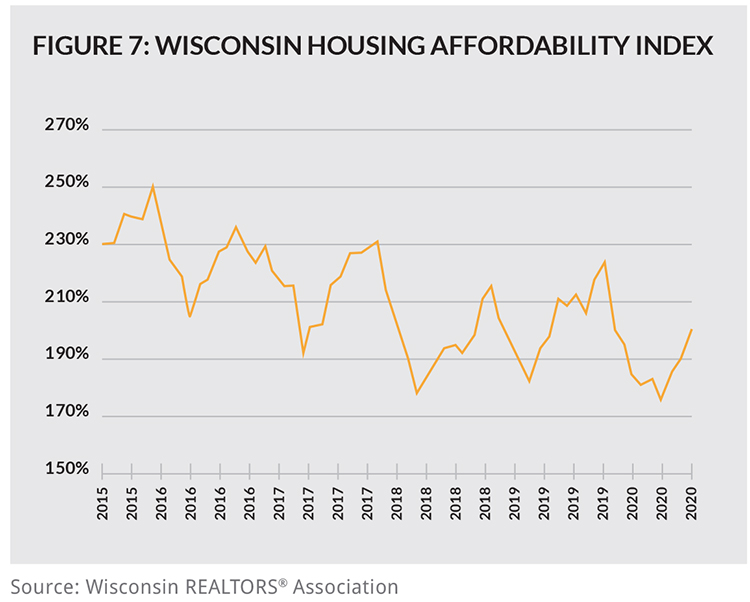
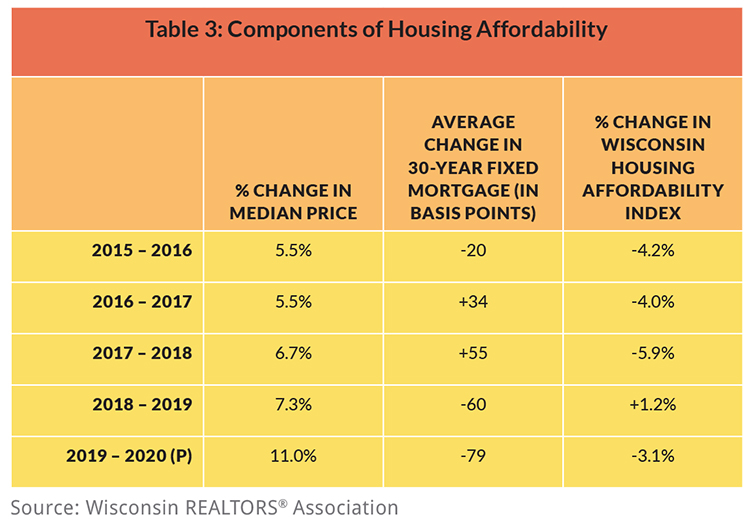
Table 3 shows why the decline in affordability moderated. Even though the median price appreciation in the last two years has been stronger than the previous three years, the substantial reduction in the 30-year fixed mortgage rate has kept the Wisconsin Housing Affordability Index from decreasing more dramatically. Indeed, between 2018 and 2019, when prices increased 7.3%, affordability actually increased slightly because the average mortgage rate fell from 4.54% to 3.94%, a fall of 60 basis points.
2021 expectations for the housing market
Although 2020 was a challenging year, the Wisconsin housing market performed well for several reasons. Even before the recession began, millennials had finally begun to transition from rental housing to homeownership. However, baby boomers have delayed their decision to downsize, keeping supply tight. The actions of the federal government to lower short-term interest rates resulted in record-low mortgage rates, which further stimulated the demand side of the market. This mismatch between supply and demand resulted in robust sales growth even in the midst of one of the most significant economic disruptions in the last decade. REALTORS® adapted quickly to the unique challenges of the pandemic, and this has led to record sales and record-high home prices.
As we begin 2021, there are reasons for optimism, but there remain some significant challenges. On the positive side, it appears that the recession is winding down, and the distribution of a successful COVID-19 vaccine should further enhance growth in the economy. In short, if we are not already in a recovery, we should be shortly. Second, the federal government has indicated that it is not concerned with inflation, and hence the low interest rate environment should continue; and as long as inflation remains in check, mortgage rates should remain low. A growing economy and low mortgage rates will keep housing demand strong. The primary challenge is the weak supply of housing in the state. However, the aging baby-boom generation is expected to cause an increase in the number of new listings, and the 2020 uptick in new single-family residential building should continue into 2021, perpetuating a strong seller’s market in Wisconsin for the foreseeable future. This will continue to put solid upward pressure on prices. If mortgage rates are near their low point, then the decline in affordability will once again accelerate. Overall, it is a safe bet that prices will continue to increase well above the rate of inflation. However, until housing supply improves, sales will have difficulty growing as quickly as they did in 2020.
David Clark, Ph.D., is a professor of economics at Marquette University and principal at ECON Analytics, LLC, and serves as a consultant for the WRA in the analysis of home sales data as well as in the preparation of the monthly Wisconsin Housing Report. For more information, contact Clark at 414-803-6537.